Managing Management - Interview Journey and Calibration
28 May 2020Instrumenting the journey of people you interview is critical to understanding and improving your interview processes. With instrumentation you set up concrete feedback loops that give you insight and opportunities to improve your interviewing. I’ve used two Applicant Tracking Systems (ATS), Lever and Greenhouse, and neither provided the data in the format I wanted. Spreadsheets are SaaS apps waiting to be built so let’s walk through the spreadsheet solution I built to instrument the interviewing funnel.
In this post we’ll walk through the spreadsheet I built with my fantastic recruiting partner Daren to help solve this problem: Candidate Journey Tracker. This sheet has sample data for interview loops that are simple: one phone screen and if the candidate advances we have an onsite consisting of three technical interviews. We use the Lever system for evaluating candidates: 1 (strong no hire), 2 (no hire), 3 (hire), 4 (strong hire).
Candidates
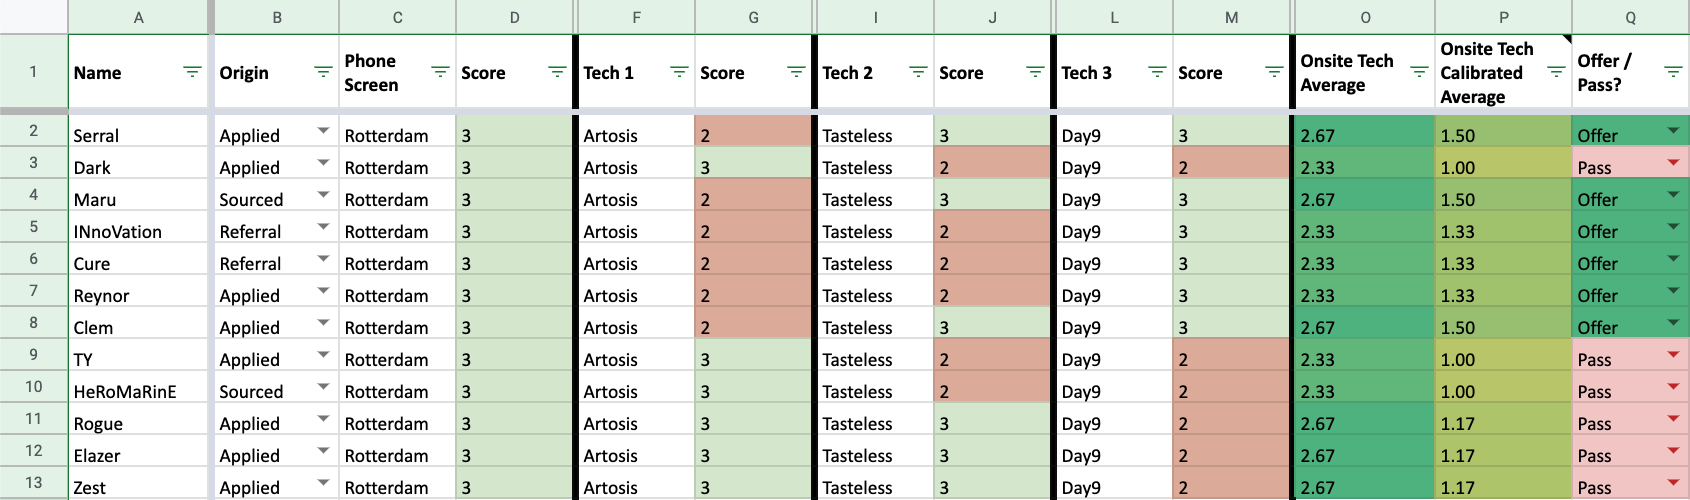
Our first stop is the Candidates sheet. For any candidate that advances to the onsite stage we add their information to this sheet. This gives us a single place to review all candidates we’ve brought onsite in a single place and easily answer questions like:
- What do onsite scores look like for offer-stage candidates today and in the past?
- Are there any trends between candidate origin and onsite result?
- How do candidates a particular person advances from phone screen do in onsites?
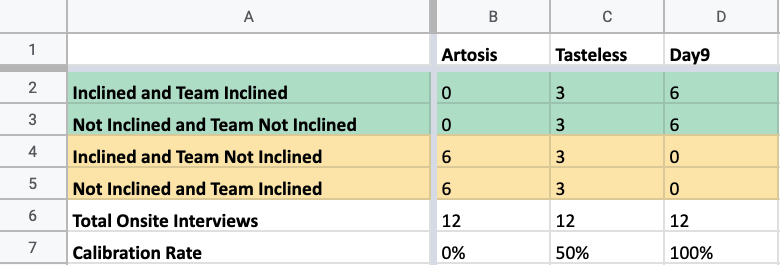
With candidate journey data collected in a single place we can now do interesting analysis around calibration. Calibration here means alignment between an each interviewer’s assessment of the candidate and the final decision for the candidate. An interview is more calibrated if they are inclined when the panel is inclined or when they are not inclined and the panel is not inclined. When there is a mismatch, the interviewer is less calibrated.
Calibration Analysis
For our sample data above you’ll notice that Day9 is perfectly calibrated: whenever Day9 is inclined to hire, the panel is inclined to hire and when he’s not inclined, the panel’s not inclined. Artosis is the exact opposite; some say he’s cursed. Tasteless is more a coin-flip: half the time he’s calibrated.
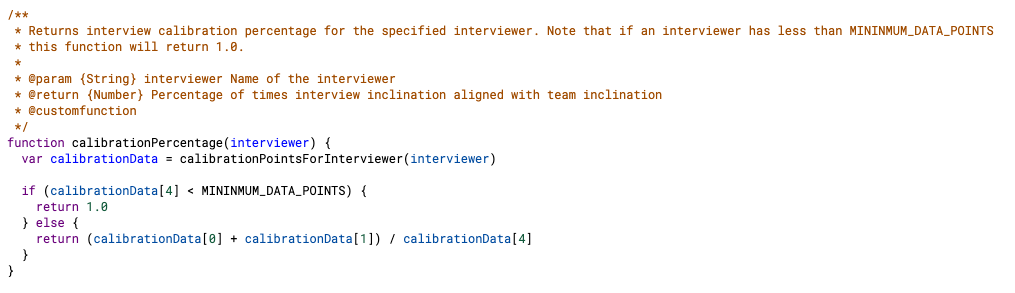
calibrationPercentage
There’s no need to do this analysis manually though! Using Google App Scripts (Tools -> Script Editor) you can write custom functions that calculate calibration percentage for every interviewer. The Calibration Analysis sheet shows off the custom calibrationPercentage function.
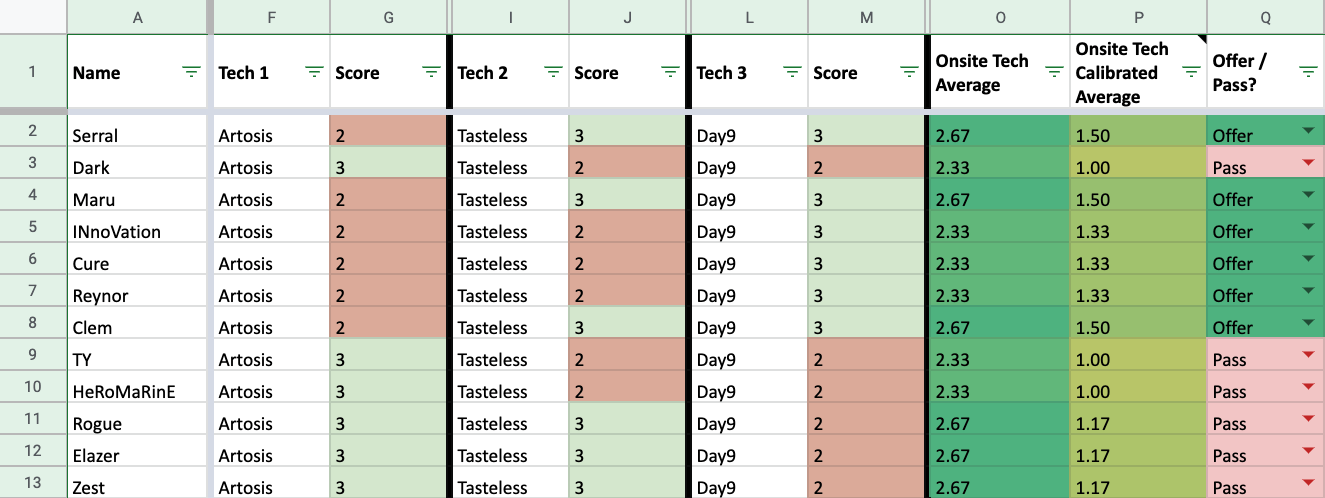
Candidates Revisited
With this function we can revisit our Candidates sheet and do some math. Astute observers will notice the sheet had the average score of onsite interviews and also a calibrated average of onsite interviews. The calibrated average adjusts each interviewer’s score based on their calibration percentage. Unless you’re perfectly calibrated this means your scores will be adjusted downwards. For our sample data, Day9’s scores aren’t adjusted (e.g. a 3 stays a 3) because he is perfectly calibrated; Tasteless’s scores are calibrated downwards by 50% (e.g. a 3 becomes a 1.5) because Tasteless has a 50% calibration; and Artosis’ scores are ignored (e.g. a 3 becomes a 0) because he is never calibrated. This calibrated average score provides another lens through which to view a candidate’s performance.
There are a few things worth highlighting before we close out this post:
- This spreadsheet should not be used for deciding whether to move to offer-stage with a candidate. Having past data and concrete numbers in front of you can tempt you into simply making the offer decision a numbers game but you should avoid doing this.
- Our sample data has three technical interviews but real onsites are rarely so uniform. Different interviewers will probe different technical and behavioral competencies. If a particular competency is easily handled by many candidates or catches many candidates off guard this will affect that particular interviewer’s calibration.
- Calibration percentage calculation looks at all data points for an interviewer and applies that percentage to all their scores. An alternate system would only look at past data points when calculating this percentage, but this would hurt data sample size for earlier interviews.
In closing, this spreadsheet has been helpful tool to help assess the quality of our interviewing and there’s so much more that can be built off of it (e.g. percent accuracy for phone screeners). Got an interesting tip that helps you better understand how calibrated your interviewing is? Let me know on Twitter!
Managing Management is a series on systems that are shareable and serve as actionable templates for addressing the deluge of things managers encounter everyday. Enjoyed this post and want to see more? Check out more at Managing Management.